

Steam's Community Market appears simple at first glance. You list an item, wait for it to sell, and occasionally check the chart. But if you’ve spent more than a few hours watching CS2 skin prices, you know it’s rarely that straightforward.

Prices climb, drop, stall, or spike for no clear reason. They move for a variety of reasons, including sales and the opening of a single lucky case on Twitch.
This page examines how those numbers are formed and what drives them, using real-world examples from the CS2 marketplace. You’ll learn to read the built-in graphs, understand seasonality, and make smarter timing decisions without trying to “day-trade” digital skins.
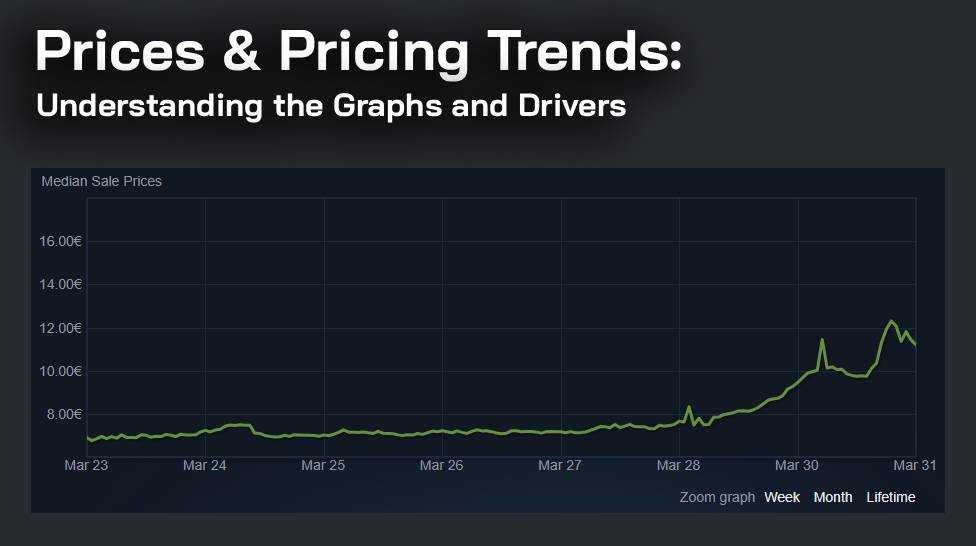
When you click "View in Community Market" for a CS2 skin, you will see a graph rather than a live ticker. It's a rolling chart that includes all successful sales over the last 30 or 90 days.
Each dot represents a completed transaction, not a listing. That’s important, because listing prices can sit far above actual sales for days without affecting the chart.
Steam smooths the data, removing extreme outliers, for example, accidental listings at $0.01 or $5,000. It’s useful for spotting trends, but it can hide short bursts of volatility. If you’ve ever watched a rare sticker jump 50% in a day and then “disappear” from the chart, that’s why.
Outliers typically occur when:
Over time, you begin to recognize familiar shapes, slow climbs before updates, and sudden cliffs after major patches. Think of them as mini market cycles.
Price movements in the CS2 Steam Market are rarely isolated. They are typically triggered by external events.
Valve does not announce every backend change, but the community can identify patterns. Here are the primary drivers of market volatility:
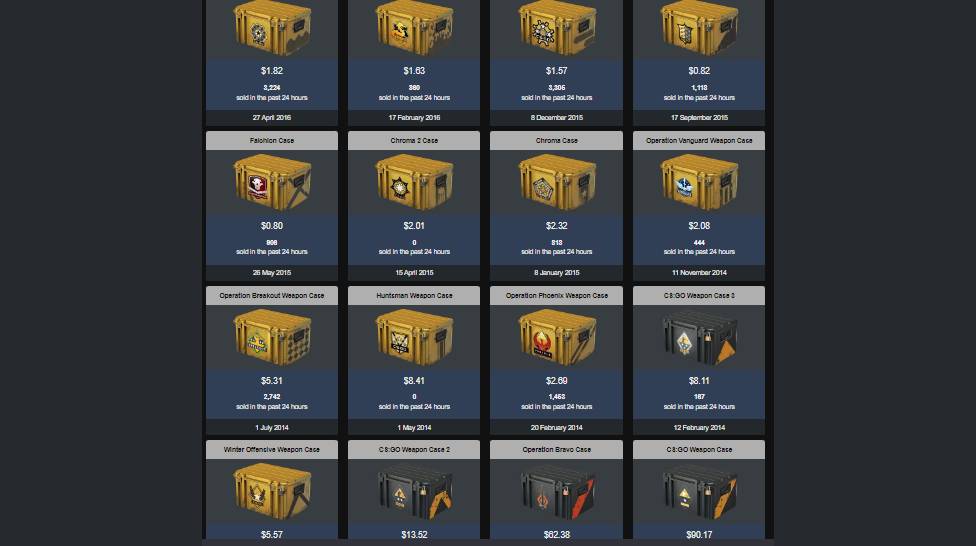
When Valve introduces a new Operation or Case, attention shifts. Older cases frequently experience brief price drops as players liquidate to purchase the new content. A month later, the older cases begin to rise again; fewer drops, less supply.
The Operation Riptide case is a textbook example: it began at $0.30, hovered for months, and then climbed above $2 after rotation ended.
Weapon tweaks and visual changes have an impact on demand. When a new skin looks better with updated lighting, the price increases. When a gun gets nerfed, skins drop temporarily. It's subtle, but visible on charts: short valleys that recover within a week or two.

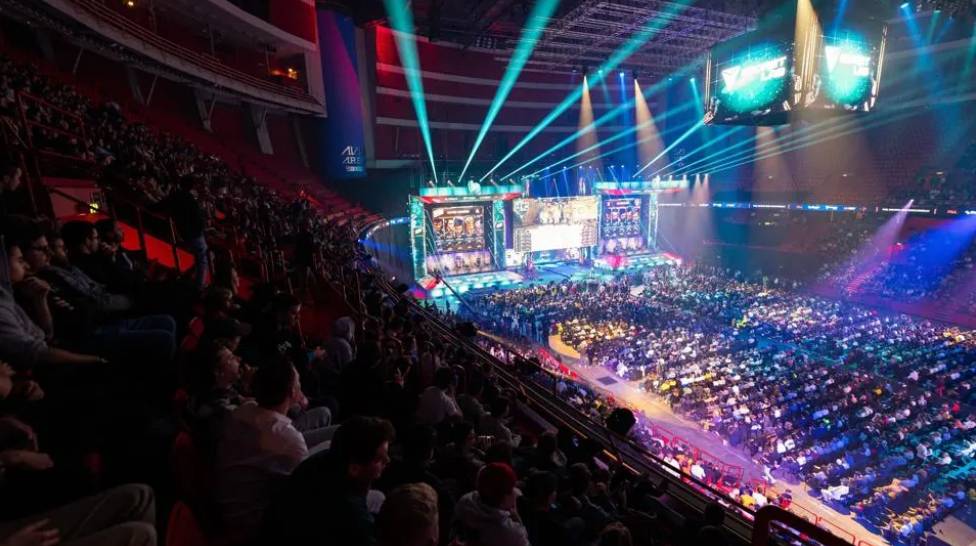
When a major tournament occurs, sticker and souvenir prices frequently rise. Remember the Antwerp 2022 boom? Overnight, the entire number of sticker capsules doubled.
Those spikes typically fade after the event, but the best-looking or rare signature stickers frequently retain their value.
Summer and winter sales affect the market in unusual ways. Players cash out items to purchase discounted games, increasing the supply. Prices fall by 10-20% across common skins before recovering in July or January when spending slows.
If you're patient, these sales are ideal for resellers and collectors.

Reading Steam graphs is similar to reading financial charts in that it follows the same principles but requires less math. The idea isn’t to predict the future, just to recognize behavioral patterns.
Here are a few patterns to keep an eye on:
| Pattern Type | What It Means | How to React |
| Gradual Uptrend | Consistent demand, limited supply | Good for long-term holding |
| Sharp Spike, Fast Drop | Hype or manipulation | Avoid buying mid-spike |
| Flat Line, Low Volume | Illiquid item | Hard to sell quickly |
| Periodic Dips | Seasonal or event-driven | Opportunity for lower entry |
| Sudden Volume Surge | News or influencer impact | Wait 24–48h to confirm stability |
In traditional markets, support is the price at which buyers enter, while resistance is the price at which sellers flood the market. These levels also exist on Steam.
When an item repeatedly bounces around $1.20–$1.25, that’s a support zone. When it struggles to break $2, that is resistance.
Understanding those levels allows you to set reasonable listing prices, slightly below resistance if you want a quick sale, or near support if you're hoping for a rebound.
Every December, the same pattern emerges: active player counts increase, casual traders return, and skins with festive colors (reds, greens, and white patterns) experience minor surges.
Then, in late January, things cool off again.
It’s not perfect science, but knowing these rhythms can help you avoid panic selling.
Let’s connect the dots on how you actually use this data to make smarter moves.
First, remember that every sale on Steam takes a 15% total cut. 10% goes to the game developer (Valve for CS2), and 5% goes to Steam itself.
If a skin sells for $10, the seller receives $8.50. That means if you bought that item at $8.50, you’d need to resell it above $10.05 just to break even. Timing matters more than most realize. A few cents can eliminate your margin.
Here are a few practical rules of thumb:
Let’s say you buy a Classic Knife | Fade (Factory New) for $450 and later sell it for $500.
Profit: $-25 loss.
You'd need to sell for around $550 to make a profit. That is why serious market participants track their net value rather than just the sale price.
When you trade smaller items (under $5), the math becomes even tighter, but those markets also move faster.
Here's a simple example table of some common CSS2 items:
| Item | 30-Day Avg | 90-Day Trend | Liquidity Note | Tip |
| AK-47 | Redline (FT) | $7.20 | Slight Uptrend (+4%) | High |
| M4A1-S | Nitro (MW) | $1.05 | Stable | Medium |
| Operation Bravo Case | $12.80 | Uptrend (+18%) | Low | Rare drop, but slow to sell |
| Sticker | Vitality (Paris 2023) | $0.45 | Slight Downtrend (–6%) | Very High |
| Navaja Knife | Case Hardened (FT) | $85.00 | Volatile | Low |
These are not price predictions, but rather reference patterns. The actual numbers change daily, but the relationships (high liquidity vs. slow movers) remain consistent.
A skin's "price" is meaningless if it doesn't sell. Liquidity, how quickly an item can be converted back into Steam Wallet funds, determines its true value. Common rifles, cases, and stickers have liquidity. Rare knives or souvenir drops often sit listed for weeks.
If you’re trying to build a small trading bankroll inside Steam, focus on high-volume, mid-price items between $0.50–$10. They’re easy to flip, less risky, and less affected by one or two listings disappearing.
People sometimes use the term "market cap" when discussing CS2 items, but this is an informal term. Valve does not publish official totals.
Still, it’s possible to estimate. Multiply an item’s average price by the number of listings, and you get a ballpark figure.
For popular cases or stickers, this can amount to millions of dollars in circulating value. The most important takeaway: the CS2 market behaves like a real economy, with supply, demand, speculation, and regulation, but without fiat withdrawals.
The price examples provided here are based on live Community Market data that has been averaged over several months. We filtered out short-term anomalies, rounded values to two decimals, and ignored listings that never filled.
When estimating trends, we compared 30-day and 90-day averages to identify persistent direction, not momentary jumps.
External references include:
We avoid any third-party resale data in order to fully comply with Steam's Terms of Service.
CS2 market pricing is not random. It combines behavioral economics and game design. When you understand how graphs, fees, and events interact, the chaos becomes more manageable. You'll notice when demand dries up, when hype builds, and when to simply wait.
The Steam Market rewards patience over prediction. Watch the charts, learn the rhythm, and you'll eventually recognize when the numbers are quietly working in your favor.
Why do some prices remain flat for weeks?
Usually, because the volume is low. If only one or two items sell each week, the price graph barely changes.
What causes the sudden spikes?
Either a patch, a big streamer opening that item, or artificial hype. Wait 24–48 hours before reacting.
Do regional currencies influence prices?
Yes, prices are displayed in your local currency, and exchange rates have a subtle impact on cross-region averages.
Why is my item labeled "delisted" or "no recent sales"?
That simply means that no completed trades were recorded recently, not that the item vanished.
Are Steam Market graphs active?
They update every few hours. It’s not a real-time feed.
How frequently does Valve adjust market rules?
Fee changes or anti-fraud updates can occasionally cause temporary shifts in liquidity patterns.


![How to Win Real Money Online with CS2 Slots (Guide [year])](/imgs/news_8209/20250512/cache/1747040856_c87646d19a667fd9d63c___308_174.jpg "How to Win Real Money Online with CS2 Slots (Guide [year])")

